Close Icon

Community Action Plan – Performance Data – Progress on Strategies

Click the buttons below to view performance data on progress towards the Action Plans goals within reach, progress on strategies, and progress toward housing goals.

Goals Within Reach
Progress on Strategies
Progress Toward Housing Goals


Progress On Strategies

Click on the links below to view performance data. The Action Plan identifies three goals and five strategies that should be tracked and reported. Narrative accomplishments related to the five strategies can be viewed under “Activity Accomplishments.” Performance data related to three of the five strategies can be found by clicking the links below.

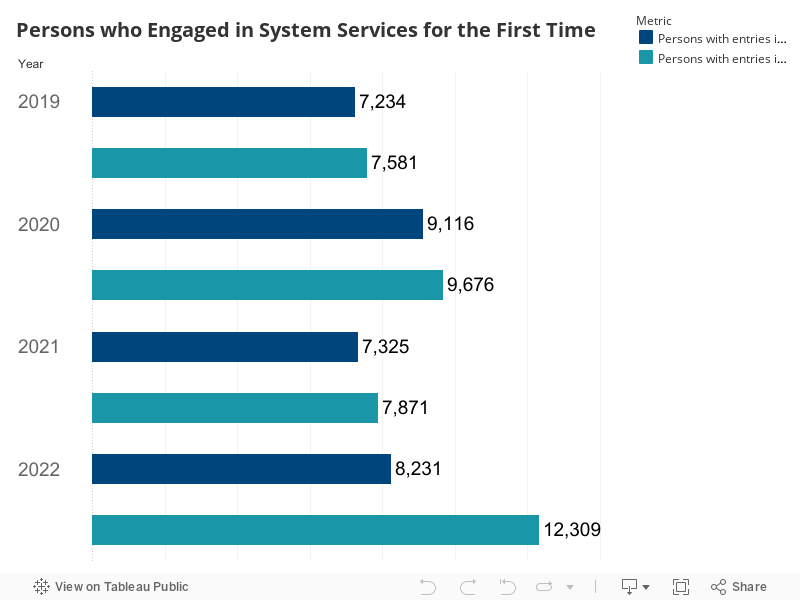
  1. Decrease inflow through increase of prevention and diversion.
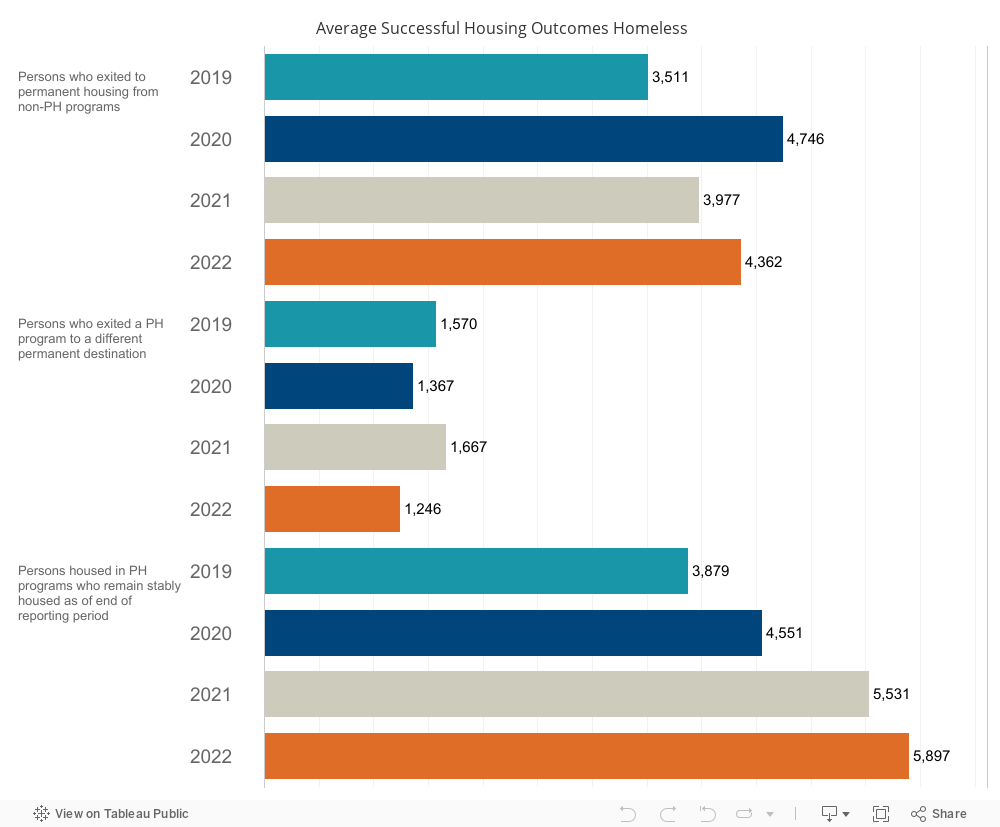
  2. Improve the performance of the existing system.
  3. Increase the production of/access to permanent solutions.


<strong>First Time Engagement </strong><strong>Returns to Homelessness</strong>

Source: The Regional Task Force on the Homeless (RTFH) System Performance Measures (SPM 5.2) with minor revisions to reporting logic to provide additional transparency.

HUD requires communities to track and report to HUD annually a set of metrics known as System Performance Measures (SPM). These measures provide important information about the performance of the overall system of care that persons experiencing homelessness access, help to identify gaps and barriers where improvements are needed and inform HUD when annual funding decisions are made. RTFH tracks and reports on seven different SPM.

HUD uses System Performance Measure (SPM) 5 to estimate the total number of persons who are experiencing homelessness for the first time based on whether or not they entered programs for the first time in the past 24 months. Because this is not a complete representation of whether these clients were experiencing homelessness for the first time or just had gaps between entries in programs, the graph above that utilizes this logic was titled “Number of Persons who Engage in System Services for the First Time in the Past 24 Months” to more accurately describe the information presented.

The graph above reports figures that were calculated using a modified version of the HUD SPM 5.2 reporting logic. HUD SPM 5.2 does not include Street Outreach to determine the number of persons experiencing homelessness for the first time. To ensure that the data that captures unsheltered persons are being considered, the graph above reports on the total number of persons who engaged in system services for the first time in the 24 months prior to the specified reporting period, including persons who engaged in Street Outreach. This is accomplished by observing all clients who entered any programs within the San Diego Continuum of Care (CoC) in the 24 months prior to the reporting period. This group is then compared to the group of clients that entered programs within the City during the reporting period. Clients are counted if they appeared only in the second list.

While HUD’s SPM methodology only looks at the 24 months prior to the reporting period in assessing whether a person is experiencing homelessness for the first time, this measure was modified for this dashboard to calculate one set of data using the 24-month period and another set of data using all available historical data. The second method would not count a client as experiencing homelessness for the first time if they had any prior HMIS enrollments in the program types listed below at any time. The figures produced by the 24 month look-back method and the all-time look-back method are both represented in the chart above.

While HUD’s SPM methodology only looks at the 24 months prior to the reporting period in assessing whether a person is experiencing homelessness for the first time, this measure was modified for this dashboard to calculate one set of data using the 24-month period and another set of data using all available historical data. The second method would not count a client as experiencing homelessness for the first time if they had any prior HMIS enrollments in the program types listed below at any time. The figures produced by the 24-month look-back method and the all-time look-back method are both represented in the chart above.

ES: Emergency Shelter

SH: Safe Haven

TH: Transitional Housing

SO: Street Outreach

PH: Permanent Housing


Source: The Regional Task Force on the Homeless System Performance Measures (SPM 2)

HUD requires communities to track and report to HUD annually a set of metrics known as System Performance Measures (SPM). These measures provide important information about the performance of the overall system of care that persons experiencing homelessness access, help to identify gaps and barriers where improvements are needed and inform HUD when annual funding decisions are made. RTFH tracks and reports on seven different SPM.

SPM 2 measures the extent to which persons who exited from (SO, ES, SH, TH, PH) to permanent housing destinations return to homelessness within 24 months. This is gathered by observing those who exited to permanent housing two years prior to the reporting period, and counting how many of those re-entered into the homeless system (SO, ES, SH, TH, or PH) within the next two years.

As of January 1, 2020, 442 persons returned to homelessness after exiting from (SO, ES, SH, TH, PH) to a permanent housing destination in 2017. This represents 14.26% of the total number of persons who exited to a permanent housing destination in 2017.

As of January 1, 2021, 692 persons returned to homelessness after exiting from (SO, ES, TH, PH) to a permanent housing destination in 2018. This represents 17.39% of the total number of persons who exited to a permanent housing destination in 2018.

As of January 1, 2022, 667 persons returned to homelessness after exiting from (SO, ES, TH, PH) to a permanent housing destination in 2019. This represents 20.49% of the total number of persons who exited to a permanent housing destination in 2019.

As of January 1, 2023, 826 persons returned to homelessness after exiting from (SO, ES, TH, PH) to a permanent housing destination in 2020. This represents 22.79% of the total number of persons who exited to a permanent housing destination in 2020.

This data indicates an increase in the number and percentage of people returning to homelessness year-over-year. It is not possible to assess based on the data alone the specific underlying factors that contributed to this trend. However, it is important to consider the broader context of the regional and national challenges experienced in the last several years and the economic impacts of the COVID-19 pandemic.

ES: Emergency Shelter

SH: Safe Haven

TH: Transitional Housing

SO: Street Outreach

PH: Permanent Housing


<strong>Average Length of Time Homeless</strong><strong>Employment and Income Growth</strong>

Source: The Regional Task Force on the Homeless System Performance Measures (SPM 1)

HUD requires communities to track and report to HUD annually a set of metrics known as System Performance Measures (SPM). These measures provide important information about the performance of the overall system of care that persons experiencing homelessness access, help to identify gaps and barriers where improvements are needed and inform HUD when annual funding decisions are made. RTFH tracks and report on seven different SPM.

SPM 1 measures the length of time persons experience homelessness using two different methodologies.

Measure 1b measures the average length of time homeless for persons based on a combination of their length of stay in ES, SH, TH, and PH programs and their self-reported answers to questions about their history of homelessness. Measure 1b calculates average length of time homeless using length of stay in temporary programs, but also considers whether persons report that the approximate date their homelessness began occurred prior to their enrollment in a temporary program.

If someone reports that the date their homelessness started was prior to the date they enrolled in ES, SH, TH, the self-reported date their homelessness started is used as the start date in calculating their length of time homeless. Measure 1b also includes persons served by PH programs based on their self-reported history of homelessness. Inclusion of self-reported data results in Measure 1b trending higher than Measure 1a, but also ensures that a person’s self-reported history of homelessness is accurately represented when assessing the average length of time a person is homeless in San Diego. Therefore, Measure 1b is the measure that is being monitored.

The average length of time homeless increased between 2021 and 2022. This is in part due to the impacts of the COVID-19 pandemic, the end of the eviction moratorium, low vacancy rates for rental housing, landlord hesitancy during a period economic uncertainty, and limited employment opportunities, among other factors.

ES: Emergency Shelter
SH: Safe Haven
TH: Transitional Housing
PH: Permanent Housing


Source: The Regional Task Force on the Homeless System Performance Measures (SPM 4)

HUD requires communities to track and report to HUD annually a set of metrics known as System Performance Measures (SPM). These measures provide important information about the performance of the overall system of care that persons experiencing homelessness access, help to identify gaps and barriers where improvements are needed and inform HUD when annual funding decisions are made. RTFH tracks and report on seven different SPM.

SPM 4 measures employment and income growth for persons experiencing homelessness enrolled in any homeless-dedicated program in the City of San Diego. An active program participant is a client who has been enrolled in a program for a minimum of 365 days, and was still enrolled in a program at the end of the calendar year. This measure does not capture clients who were enrolled in a program for less than 365 days and increased their income. The 2021 Measure 4 data reflects an increase from 2019 and 2020 in the percentage of active City program participants who increased income. Apart from real increases in client income, this may also reflect higher data quality for income data, per the Regional Task Force on Homelessness (RTFH). The 2022 Measure 4 data reflects a decrease of 11% from 2021 in the percentage of active participants who increased income. Underlying factors affecting this decrease include a significant increase in the number of active program participants overall from 2021 to 2022, as well as a decrease in the number of active participants who increased income. Data quality may also impact this due to inconsistencies in how regularly staff across the community enter income updates in HMIS.

SPM 4 also measures employment and income growth for persons who exited City programs as of the end of the calendar year. The percentage of persons who exited with increased total income decreased from 2019 to 2020 and 2021 because the total number of persons who exited the homelessness response system in these years significantly increased. This is partly due to an increase in turnover in emergency shelters. The addition of a significant number of emergency shelter beds, including beds that were added temporarily to utilize as isolation space in response to the pandemic, also contributed to this fluctuation and increase in exits. Additionally, City Street Outreach programming was expanded in 2021. This may have had an impact on the data due to an increase in the number of clients served and exited overall in the City.

<strong>Successful Housing Outcomes</strong><strong>PSH Developments</strong><strong>Street Outreach to Permanent Housing </strong>

Source: The Regional Task Force on the Homeless (RTFH)

The graph above reports on successful housing outcomes for persons served through programs in the City during 2019 and 2020. These outcomes include:

  1. Total persons who exited to permanent housing destinations from non-permanent housing programs. This metric reports all persons who exited front-line service programs within the City (including Emergency Shelters, Transitional Housing, Street Outreach, etc...) to permanent destinations.
  2. Persons who exited a PH program to a permanent destination. This metric reports all persons who exited permanent housing programs during the reporting period to other permanent housing destinations (such as attaining housing in the private market outside a PH program, moving in with family/friends, moving into a unit in another PH program, etc...).
  3. Persons enrolled in Permanent Housing (PH) programs who remain stably housed as of the end of the reporting period. This metric reports all persons in housing programs in the City of San Diego who remained stably housed in PH programs as of the end of the reporting period.


This graph shows the number of new permanent supportive housing (PSH) units that were developed and active for each calendar year. Only units that received a voucher from SDHC are included in this graph.


Source: The Regional Task Force on the Homeless System Performance Measures (SPM 7a.1)

HUD requires communities to track and report to HUD annually a set of metrics known as System Performance Measures (SPM). These measures provide important information about the performance of the overall system of care that persons experiencing homelessness access, help to identify gaps and barriers where improvements are needed and inform HUD when annual funding decisions are made. RTFH tracks and report on seven different SPM.

SPM 7a.1 measures the percentage of persons who were housed upon exit from Street Outreach programs. This is calculated by dividing the total number of persons that exited Street Outreach programs to Permanent Housing destinations by the total number of persons that exited Street Outreach programs overall during the reporting period. Other Successful Housing destinations include temporary & some institutional destinations.